56
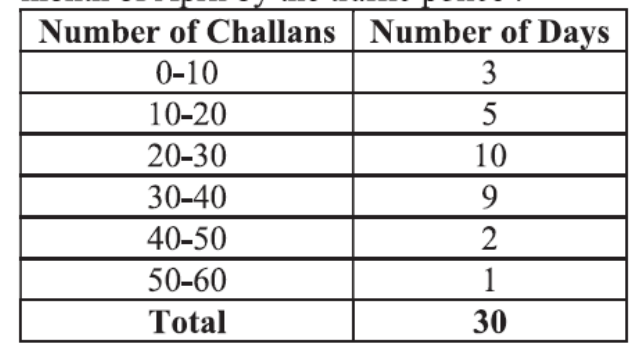
The following table shows the number of traffic challans issued in the month of April by the traffic police : Find the 'mean' and 'mode' of the above data.
Show SolutionHide Solution↓
Table:
0-10: 3, 5, 15
10-20: 5, 15, 75
20-30: 10, 25, 250
30-40: 9, 35, 315
40-50: 2, 45, 90
50-60: 1, 55, 55
Total: 30, 800
Mean $= \frac{800}{30} = \frac{80}{3}$ or $26.67$ or $27$ (approx.)
Modal class is 20-30
Mode $= 20 + \frac{10 - 5}{2 \times 10 - 5 - 9} \times 10 = \frac{85}{3}$ or $28.3$ or $28$ (approx.)
0-10: 3, 5, 15
10-20: 5, 15, 75
20-30: 10, 25, 250
30-40: 9, 35, 315
40-50: 2, 45, 90
50-60: 1, 55, 55
Total: 30, 800
Mean $= \frac{800}{30} = \frac{80}{3}$ or $26.67$ or $27$ (approx.)
Modal class is 20-30
Mode $= 20 + \frac{10 - 5}{2 \times 10 - 5 - 9} \times 10 = \frac{85}{3}$ or $28.3$ or $28$ (approx.)