57
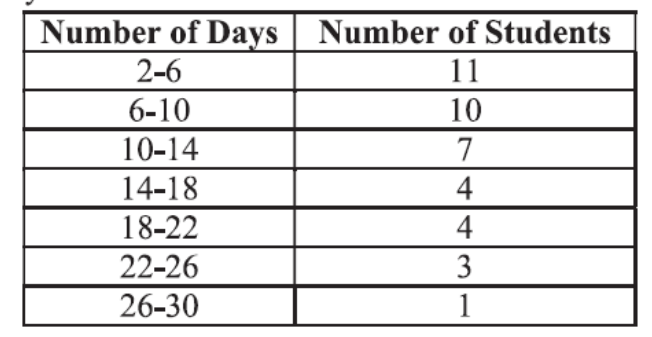
Following table shows the absentees record of $40$ students in an academic year : Find the 'mean' and the 'mode' of the above data.
Show SolutionHide Solution↓
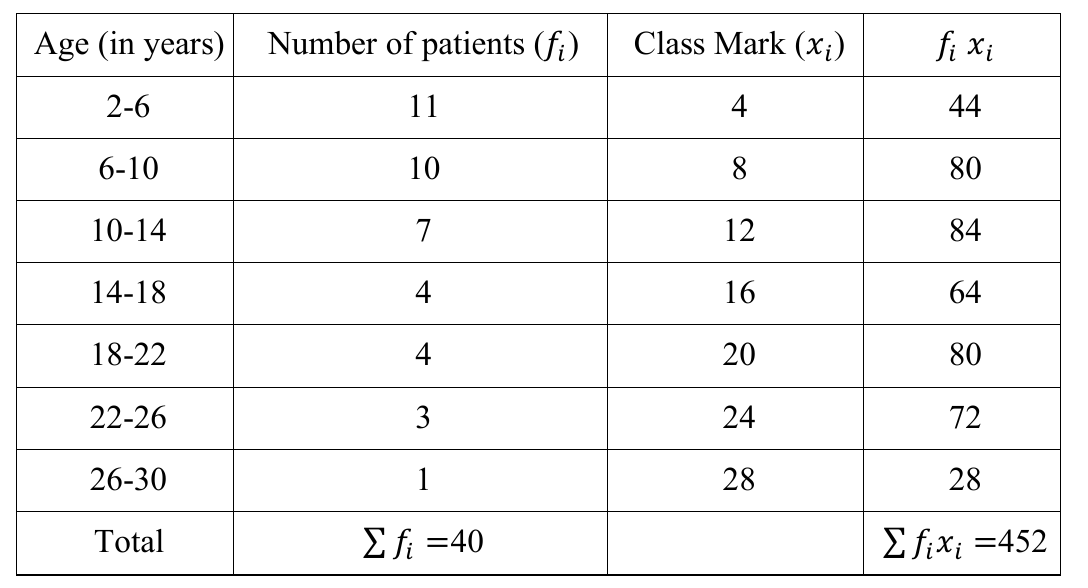
Age (in years) | Number of patients ($f_i$) | Class Mark ($x_i$) | $f_i x_i$ || 2-6 | 11 | 4 | 44 || 6-10 | 10 | 8 | 80 || 10-14 | 7 | 12 | 84 || 14-18 | 4 | 16 | 64 || 18-22 | 4 | 20 | 80 || 22-26 | 3 | 24 | 72 || 26-30 | 1 | 28 | 28 || Total | $\sum f_i = 40$ | | $\sum f_i x_i = 452$ || Mean = $\frac{452}{40} = \frac{113}{10}$ or $11.3$ years. Modal class is $2 - 6$. Mode = $2 + \frac{11-0}{2 \times 11 - 0 - 10} \times 4 = \frac{17}{3}$ or $5.67$ years (approx.)