The following table shows the ages of the patients admitted in a hospital during a year : Age (in years) 5-15 15-25…
CBSE Class 10 Maths PYQ · Statistics · Find Mean, median, mode · 5 Marks · March 2024 · Standard
Solve it yourself first — then press ↓ or tap Show Solution. Use ←→ for previous / next question.
485 Marks · March 2024 · Standard
The following table shows the ages of the patients admitted in a hospital during a year : Age (in years) $5-15$ $15-25$ $25-35$ $35-45$ $45-55$ $55-65$ Number of patients $6$ $11$ $21$ $23$ $14$ $5$ Find the mode and mean of the data given above.
Show SolutionHide Solution↓
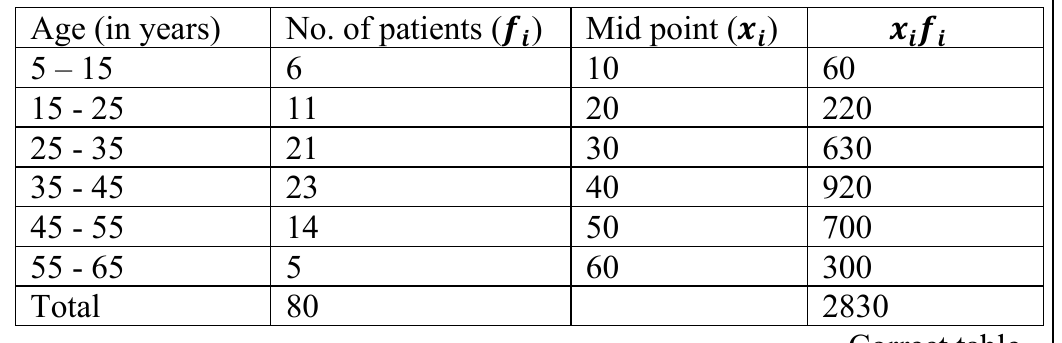
Correct table Age (in years) No. of patients ($f_i$) Mid point ($x_i$) $x_if_i$ $5-15$ $6$ $10$ $60$ $15-25$ $11$ $20$ $220$ $25-35$ $21$ $30$ $630$ $35-45$ $23$ $40$ $920$ $45-55$ $14$ $50$ $700$ $55-65$ $5$ $60$ $300$ Total $80$ $$\begin{aligned}& 2830 \\ & \Rightarrow \text{Mean } = \frac{2830}{80} \\ & = 35.375 \\ & \text{Modal class } = (35 - 45) \\ & \Rightarrow \text{Mode } = 35 + (\frac{23-21}{2\times23-21-14}) \times h \\ & = 36.81 \\ & \text{Therefore, mode and mean of given data are } 36.81 \text{ years and } 35.375 \text{ years respectively.}\end{aligned}$$