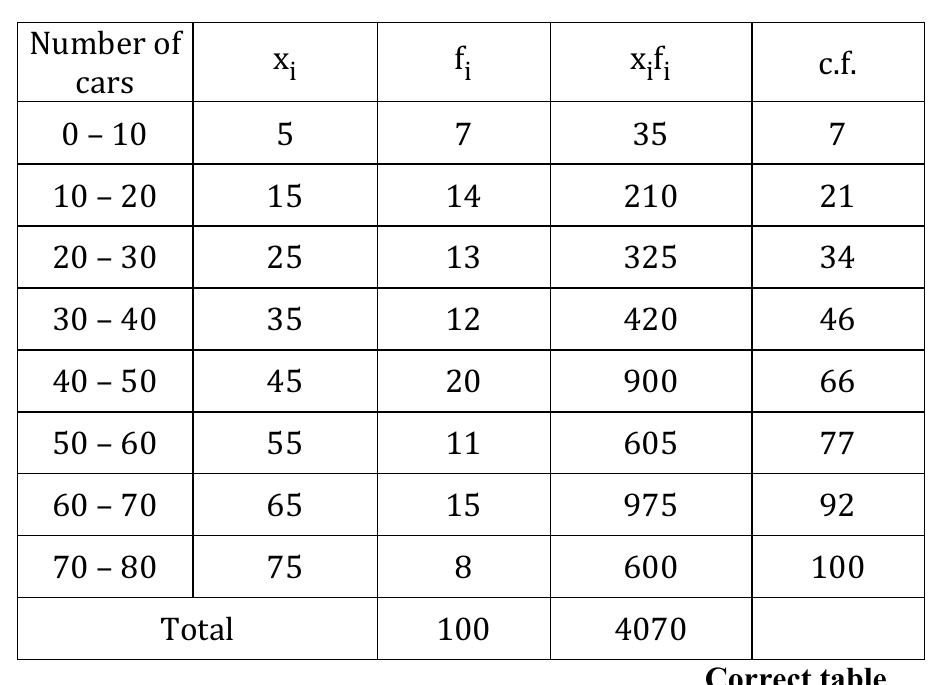
A student noted the number of cars passing through a spot on a road for 100 periods each of 3 minutes and summarised…
CBSE Class 10 Maths PYQ · Statistics · Find Mean, median, mode · 5 Marks · March 2023 · Standard
Solve it yourself first — then press ↓ or tap Show Solution. Use ←→ for previous / next question.
465 Marks · March 2023 · Standard
A student noted the number of cars passing through a spot on a road for $100$ periods each of $3 \text{ minutes}$ and summarised it in the table given below. Find the mean and median of the following data.