26
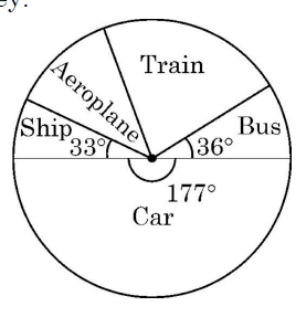
In a survey on holidays, $120$ people were asked to state which type of transport they used on their last holiday. The following pie chart shows the results of the survey.
Observe the pie chart and answer the following questions :
(i) If one person is selected at random, find the probability that he/she travelled by bus or ship.
(ii) Which is most favourite mode of transport and how many people used it?
(iii) (a) A person is selected at random. If the probability that he did not use train is $4/5$, find the number of people who used train.
OR
(iii) (b) The probability that randomly selected person used aeroplane is $7/60$. Find the revenue collected by air company at the rate of ₹5,000 per person.
Observe the pie chart and answer the following questions :
(i) If one person is selected at random, find the probability that he/she travelled by bus or ship.
(ii) Which is most favourite mode of transport and how many people used it?
(iii) (a) A person is selected at random. If the probability that he did not use train is $4/5$, find the number of people who used train.
OR
(iii) (b) The probability that randomly selected person used aeroplane is $7/60$. Find the revenue collected by air company at the rate of ₹5,000 per person.
Show SolutionHide Solution↓
(i) $P$ (travelling by bus or ship) $= \frac{36+33}{360} = \frac{69}{360}$ or $\frac{23}{120}$
(ii) Car
Number of people who used car $= \frac{177}{360} \times 120 = 59$
(iii) (a) $P$ (person used train)$= 1 - \frac{4}{5} = \frac{1}{5}$
$\therefore$ Number of people who used train $= \frac{1}{5} \times 120 = 24$
OR
(iii) (b) Number of people who used aeroplane $= \frac{7}{60} \times 120 = 14$
$\therefore$ Revenue generated$= 14 \times 5000 = \text{Rs}70,000$
(ii) Car
Number of people who used car $= \frac{177}{360} \times 120 = 59$
(iii) (a) $P$ (person used train)$= 1 - \frac{4}{5} = \frac{1}{5}$
$\therefore$ Number of people who used train $= \frac{1}{5} \times 120 = 24$
OR
(iii) (b) Number of people who used aeroplane $= \frac{7}{60} \times 120 = 14$
$\therefore$ Revenue generated$= 14 \times 5000 = \text{Rs}70,000$